Creating a Single Line Drawing Using an Image
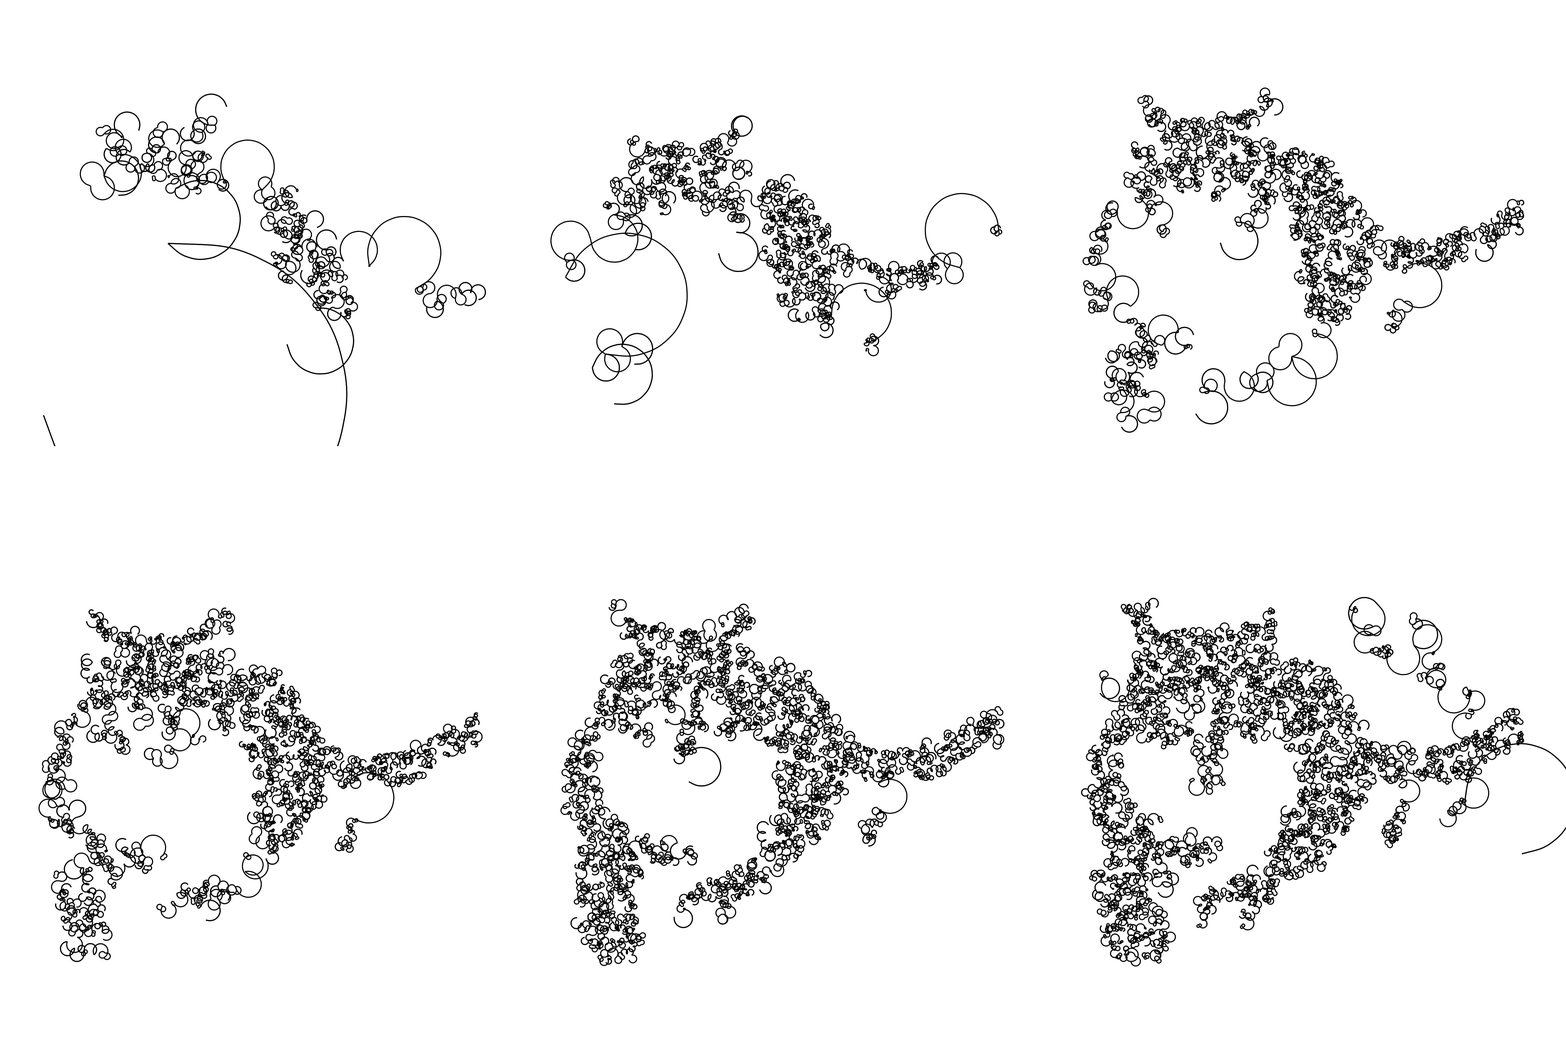
The following R code is adapted from fronkenstin’s scribble post. My code adds a for loop to iterate through the images to create a gif with each sequence being more detailed than the last. Here’s one of my cat!
1
2
3
4
5
6
7
8
9
10
11
12
13
14
15
16
17
18
19
20
21
22
23
24
25
26
27
28
29
30
31
32
33
34
35
36
37
38
39
40
41
42
43
44
45
46
47
48
49
50
51
52
53
54
55
56
57
58
59
60
61
62
63
64
65
66
67
68
69
70
71
72
73
74
75
76
77
78
79
80
81
82
83
84
85
86
87
88
89
90
91
92
93
94
95
96
97
98
99
100
101
102
103
104
105
106
107
108
109
110
111
112
113
library(imager)
library(tidyverse)
library(purrr)

file="IMG.jpg"

for (i in seq(5,35,by=5)) { # try the Fibonacci sequence

# Load, convert to grayscale, filter image (to convert it to bw) and sample
load.image(file) %>%
  grayscale() %>%
  threshold(paste0(i,"%")) %>%
  as.cimg() %>%
  as.data.frame() -> franky

# This function cuts the dendrogram in x groups and removes clusters formed by just one point
clustResultx <- function(x) {
  clustCut <- tibble(cluster_id = cutree(clusters, x)) %>% bind_cols(data)
  clustCut %>% group_by(cluster_id) %>%
    summarize(size = n()) %>%
    filter(size > 1) %>%
    select(cluster_id) %>%
    inner_join(clustCut, by = "cluster_id") -> clustCut
  return(clustCut)
  }

# This function adds the resulting segments of comparing two consecutive clustering results
add_segments <- function(x){

  df1 <- clustEvol[[x]]
  df0 <- clustEvol[[x-1]]

  new_points <- anti_join(df1, df0, by = "id")

  # If a new point is added to an existing cluster
  new_points %>%
    inner_join(df1, by = "cluster_id", suffix = c(".1", ".2")) %>%
    filter(id.1 != id.2) %>%
    mutate(d = sqrt((x.1 - x.2)^2 + (y.1 - y.2)^2)) %>%
    group_by(id.1) %>%
    arrange(d) %>%
    slice(1) %>%
    select(p1 = id.1, p2 = id.2) %>%
    ungroup -> new_segments1

  # If a new 2-points cluster is generated
  new_points %>% anti_join(bind_rows(select(new_segments1, id = p1),
                                     select(new_segments1, id = p2)), by = "id") %>%
    group_by(cluster_id) %>%
    ungroup -> unpaired_points

  unpaired_points %>% inner_join(unpaired_points, by = "cluster_id", suffix = c(".1", ".2")) %>%
    filter(id.1 < id.2) %>%
    select(p1 = id.1, p2 = id.2) -> new_segments2

  # If two existing clusters are joined
  new_points <- anti_join(df1, df0, by = c("id", "cluster_id"))

  new_points %>%
    inner_join(df1, by = "cluster_id", suffix = c(".1", ".2")) %>%
    filter(id.1 != id.2) %>%
    anti_join(new_points, by = c("id.2" = "id")) %>%
    mutate(d = sqrt((x.1 - x.2)^2 + (y.1 - y.2)^2)) %>%
    arrange(d) %>%
    slice(1) %>%
    select(p1 = id.1, p2 = id.2) %>%
    ungroup -> new_segments3

  bind_rows(new_segments1, new_segments2, new_segments3)
}

# Sample size
n <- 50*i

# Random sample of points from protograph
franky %>%
  sample_n(n, weight=(1-value)) %>%
  select(x,y) %>% mutate(id = row_number()) -> data

# Matriz of distance between points
dist_data <- dist(data %>% select(-id), method = "euclidean")

# Hierarchical clustering
clusters <- hclust(dist_data, method = 'single')

# List with all possible clusters from maximum to minimum number of clusters
nrow(data):1 %>%
  map(function(x) clustResultx(x)) -> clustEvol

# Segments of clusters
2:length(clustEvol) %>%
  map(function(x) add_segments(x)) %>%
  bind_rows() -> segments_id

segments_id %>%
  inner_join(data, by = c("p1" = "id"), suffix = c(".1", ".2")) %>%
  inner_join(data, by = c("p2" = "id"), suffix = c(".1", ".2")) %>%
  select(x = x.1, y = y.1, xend = x.2, yend = y.2) -> segments

ggplot(segments) +
  geom_curve(aes(x = x, y = y, xend = xend, yend = yend),
             ncp = 10, #the higher this is the smoother the curve
             curvature = 2.5, #how curvy ? negative values give left hand bend
             angle = 90) + #changing this also creates interesting results
  scale_x_continuous(expand=c(.1, .1)) +
  scale_y_continuous(expand=c(.1, .1), trans = scales::reverse_trans()) +
  coord_equal() +
  theme_void()

   ggsave(paste0("img_",i,".jpg"))

}
1
2
3
4
5
6
7
8
9
10
#merge images to create gif
library(magick)
library(magrittr)
list.files(path='PATH/', pattern = '*.jpg', full.names = TRUE) %>%
        image_read() %>% # reads each path file
        image_join() %>% # joins image
        image_animate(fps=4) %>% # animates, can opt for number of loops
        image_write("FileName.gif") # write to current dir
Note to self: Try using different algorithms to solve the traveling sales man problem that creates this image: Nearest Neighbors, Greedy, Random Insertion, k-Opt. Incrementally changing curvature and ncp may also lead to interesting images. This code needs to be optimized.
This post is licensed under CC BY 4.0 by the author.

.jpg)
