Connecting to MyAnimeList API to look at One Piece Ratings
I was struggling to figure out how to use MyAnimeList’s API but I figured it out and thought it would be worth sharing. Here is how I used jikan’s API to retrieve information about One Piece viewers and their reviews / scores of the anime.
I plan on creating some sort of qualitative analysis of the reviews (positive/negative sentiment). For now here is how to extract the data.
1
2
3
4
5
6
7
8
9
10
11
12
13
14
15
16
17
18
19
20
21
22
23
24
25
26
27
28
29
30
31
32
33
34
35
36
37
38
39
40
41
42
43
44
45
46
47
48
49
50
51
52
53
54
55
56
57
58
59
60
61
62
63
64
65
66
67
68
69
70
71
72
73
import requests
import pandas as pd
import time

# Define the URL and initialize an empty list to store reviews
url = 'https://api.jikan.moe/v4/anime/21/reviews?preliminary=true'
all_reviews = []

# Fetching 5 pages of reviews
for page in range(1, 35):
    new_url = f'{url}&page={page}'
    response = requests.get(new_url)

    if response.status_code == 200:
        print(f"Fetching page {page}...")
        reviews = response.json()['data']
        all_reviews.extend(reviews)
    else:
        print(f"Failed to retrieve data for page {page}. Status code: {response.status_code}")

# Extract 'username' and 'score'
data = [{'username': review['user']['username'], 'score': review['score']} for review in all_reviews]

# Create a DataFrame
op_reviews = pd.DataFrame(data)
print(op_reviews)
print(len(op_reviews))

op_reviews.to_csv('anime_reviews.csv', index=False)
print("CSV file created successfully.")

# We now have a data frame with reviews about one piece.
# Let's join the user info to this dataset

op_reviews = pd.read_csv('anime_reviews.csv')

user_info = []

for username in op_reviews['username']:
    response = requests.get(f'https://api.jikan.moe/v4/users/{username}/full')

    if response.status_code == 200:
        user_data = response.json()['data']
        user_details = {
            'username': username,
            'gender': user_data.get('gender'),
            'birthday': user_data.get('birthday'),
            'location': user_data.get('location')
        }
        user_info.append(user_details)
    else:
        print(f"Failed to retrieve data for {username}. Status code: {response.status_code}")

    # Introduce a delay of 1 second between requests
    time.sleep(1)

# Create a DataFrame with user information
user_info_df = pd.DataFrame(user_info)
print(user_info_df.head())

user_info_df.to_csv('user_info.csv', index=False)
print("CSV file created successfully.")


# Now that we have our two datasets lets merge them so i have scores and usernames
users = pd.read_csv("user_info.csv")
reviews = pd.read_csv("anime_reviews.csv")
scores = pd.merge(users, reviews, on='username', how='left')
scores.to_csv('onepiece_dataset.csv', index=False)

df = pd.read_csv("onepiece_dataset.csv")
print(df.head())
Note to self: There is a way to automatically format code in github. Try to wrap it into the portfolio.
I want to also look at how One Piece is trending on Google using pytrends.
It looks like One Piece has started trending by a LOT since August. I suspect that it is either because of the Netflix adaptation or SPOILERS because of what happened in the anime/manga recently.
1
2
3
4
5
6
7
8
9
10
11
12
13
14
15
16
17
18
19
20
21
22
23
24
25
26
27
28
29
30
31
32
33
34
35
36
import pandas as pd
from pytrends.request import TrendReq
import matplotlib.pyplot as plt

# Fetch data
trends = TrendReq()
trends.build_payload(kw_list=["One Piece Anime"])
data = trends.interest_by_region()
data = data.sort_values(by="One Piece Anime", ascending=False)
data = data.head(10)

# Reset index to make 'geoName' a regular column
data = data.reset_index()

# Set up a colormap
colors = plt.cm.get_cmap('tab10', len(data))  # 'tab10' is an example colormap

# Plotting the bar graph with different colors for each geoName
bars = plt.bar(range(len(data)), data['One Piece Anime'], color=colors(range(len(data))))

# Set x-labels as original geoNames
plt.xticks(ticks=range(len(data)), labels=data['geoName'], rotation=90)
plt.title('"One Piece Anime" Google Searches by Region')
plt.show()

# Let's see if One piece increased or decreased on Google Search overall
data = TrendReq(hl='en-US', tz=360)
data.build_payload(kw_list=['One Piece Anime'])
data = data.interest_over_time()
fig, ax = plt.subplots(figsize=(15, 12))
data['One Piece Anime'].plot()
plt.title('Total Google Searches for One Piece Anime',
          fontweight='bold')
plt.xlabel('Year')
plt.ylabel('Total Count')
plt.show()
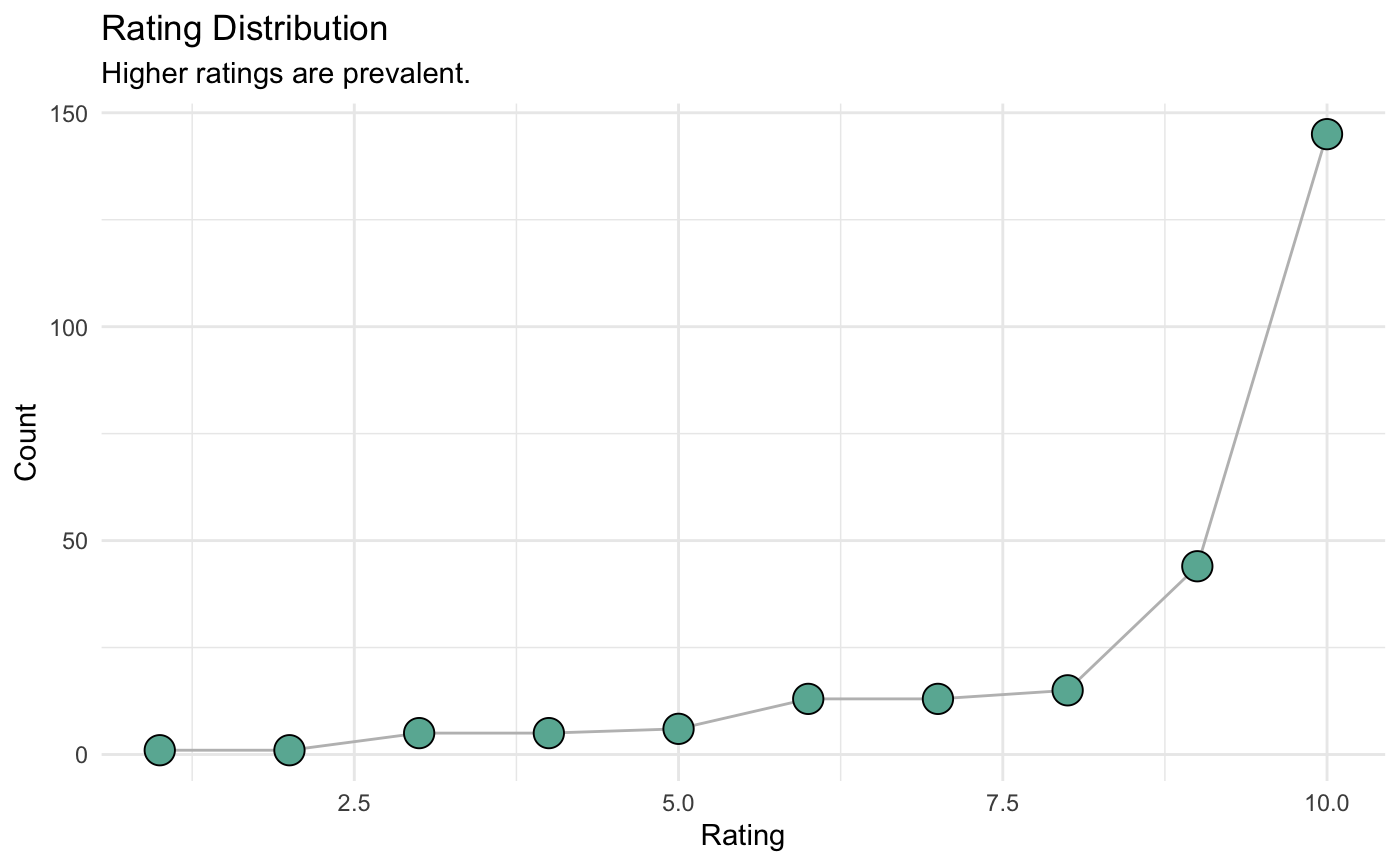
Some more visualizations of the ratings data pulled from jikans API.


