NBA Playoffs 2023
NBA Playoff Shot Selection Animation
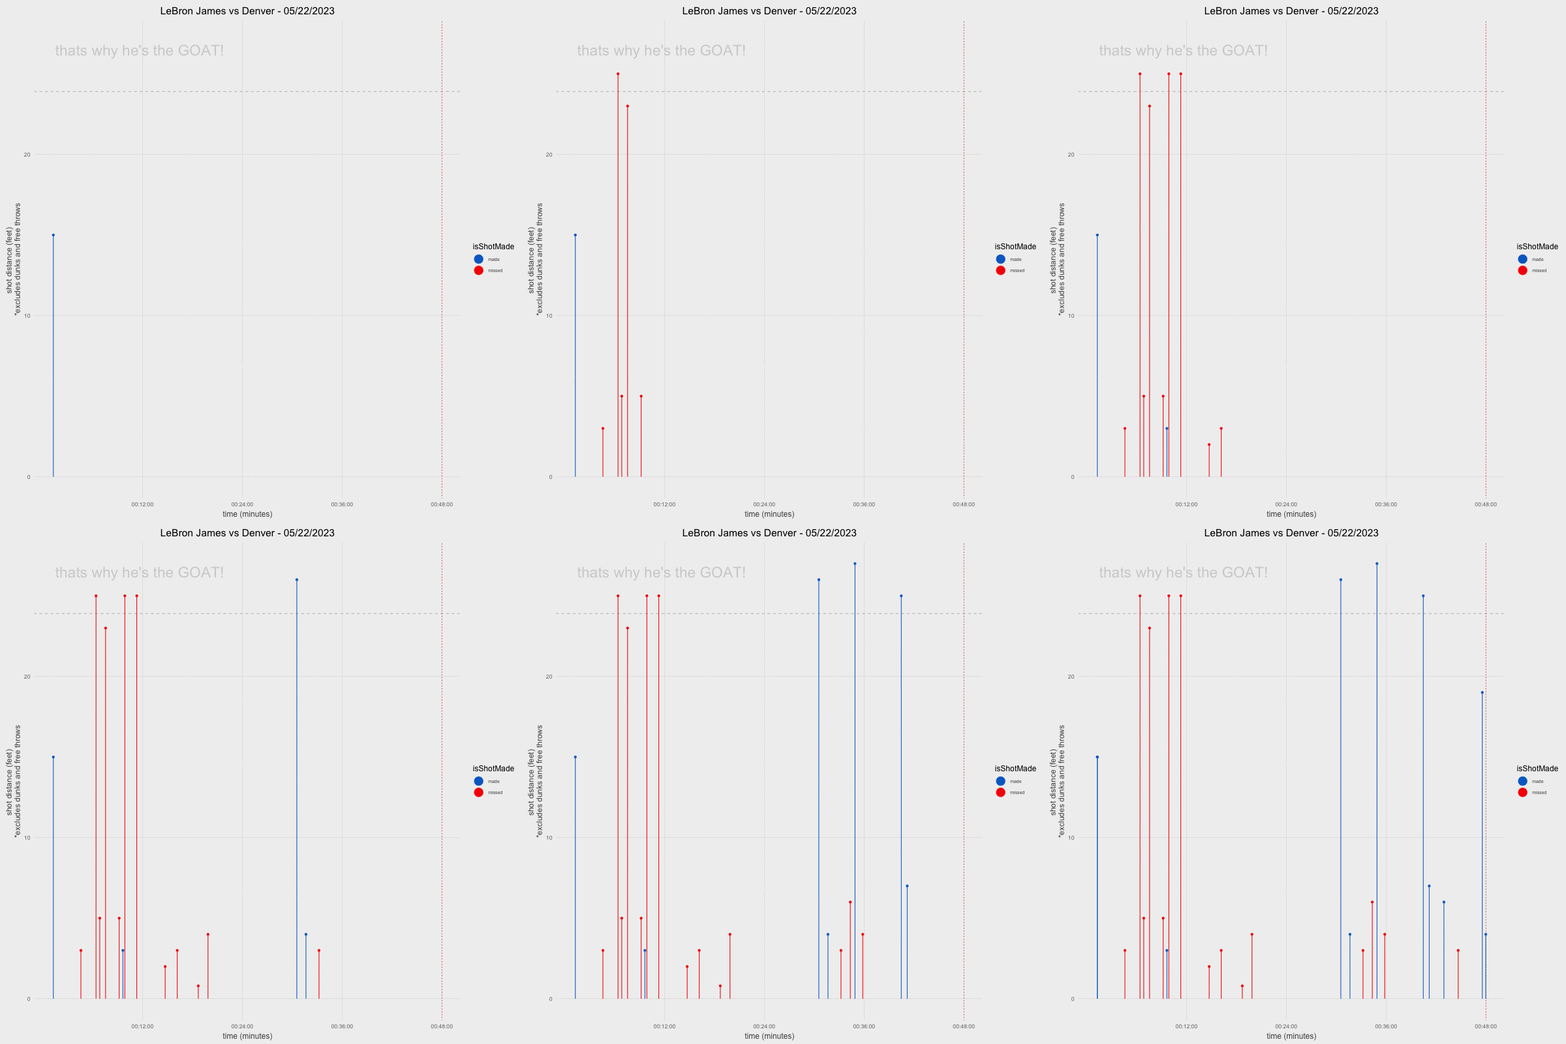
The following code creates a ShinyApp where you can select a player and game in the 2023 NBA Playoffs and view the distance of their shot and the xy coordinate of the player when the shot was released. This project was inspired by @LuisDVA’s guides.
This code will produce the following animated plots.
1
2
3
4
5
6
7
8
9
10
11
12
13
14
15
16
17
18
19
20
21
22
23
24
25
26
27
28
29
30
31
32
33
34
35
36
37
38
39
40
41
42
43
44
45
46
47
48
49
50
51
52
53
54
55
56
57
58
59
60
61
62
63
64
65
66
67
68
69
70
71
72
73
74
75
76
77
78
79
80
81
82
83
84
85
86
87
88
89
90
91
92
93
94
95
96
97
98
99
100
101
102
103
104
105
106
107
108
109
110
111
112
113
114
115
116
117
118
119
120
121
122
123
124
125
126
127
128
129
130
131
132
133
134
135
136
137
138
139
140
141
142
143
144
145
146
147
148
149
150
151
152
153
154
155
156
157
158
159
160
161
162
163
164
165
166
167
168
169
170
171
172
173
174
175
176
177
178
179
180
181
182
183
184
185
186
187
188
189
190
191
192
193
194
195
196
197
198
199
200
201
202
203
204
205
206
207
208
209
210
211
212
213
214
215
216
217
218
219
220
221
library(shiny)
library(tidyverse)
library(nbastatR)
library(ggplot2)
library(gganimate)
library(lubridate)
library(ggalt)
library(artyfarty)
library(dplyr)
library(stringr)

# To get the original dataset from nbastatsR API use the following code:
#shots2023 <- teams_shots(teams = c("Philadelphia 76ers",
                                   #"Boston Celtics",
                                   #"Golden State Warriors",
                                   #"Los Angeles Lakers",
                                   #"Orlando Magic",
                                   #"Detroit Pistons",
                                   #"Washington Wizards",
                                   #"Indiana Pacers",
                                   #"Chicago Bulls",
                                   #"Miami Heat",
                                   #"Toronto Raptors",
                                   #"Cleveland Cavaliers",
                                   #"Houston Rockets",
                                   #"New Orleans Pelicans",
                                   #"Brooklyn Nets",
                                   #"Atlanta Hawks",
                                   #"Denver Nuggets",
                                   #"Utah Jazz",
                                   #"Memphis Grizzlies",
                                   #"New York Knicks",
                                   #"Sacramento Kings",
                                   #"Charlotte Hornets",
                                   #"Minnesota Timberwolves",
                                   #"Phoenix Suns",
                                   #"Dallas Mavericks",
                                   #"Portland Trail Blazers",
                                   #"Oklahoma City Thunder",
                                   #"San Antonio Spurs",
                                   #"LA Clippers",
                                   #"Milwaukee Bucks"),
                         #seasons = 2023, season_type  = "Playoffs")

shots2023 <- read_csv("updated_shots2023.csv")


ui <- fluidPage(
  titlePanel("2023 NBA Playoffs: Shot Selection"),
  fluidRow(
    uiOutput("player"),
    uiOutput("game"),
    # Plot points horizontally next to each other
    mainPanel(
      fluidRow(
        splitLayout(imageOutput("plot", height = "100%", width = "100%"),
                    imageOutput("plot2",height = "100%", width = "100%")
                    )
        )
      )
    )
  )


# Define server logic required to draw a histogram
server <- function(input, output) {
  output$player <- renderUI({
    selectizeInput(
      inputId = "searchplayer",
      label = "Player Name",
      multiple = FALSE,
      choices = c("Search Bar" = "", paste0(unique(shots2023$namePlayer))),
      options = list(
        create = FALSE,
        placeholder = "Search Me",
        maxItems = '1',
        onDropdownOpen = I("function($dropdown) {if (!this.lastQuery.length) {this.close(); this.settings.openOnFocus = false;}}"),
        onType = I("function (str) {if (str === \"\") {this.close();}}")
        )
      )
    })

  data_filter <- reactive({
    shots2023 %>%
      filter(namePlayer == input$searchplayer)
    })

  output$game <- renderUI({
    selectizeInput(
      inputId = "searchgame",
      label = "Game",
      multiple = FALSE,
      choices = c("Game" = "", paste0(unique(data_filter()$slugMatchupDate))),
      options = list(
        create = FALSE,
        placeholder = "Search Me",
        maxItems = '1',
        onDropdownOpen = I("function($dropdown) {if (!this.lastQuery.length) {this.close(); this.settings.openOnFocus = false;}}"),
        onType = I("function (str) {if (str === \"\") {this.close();}}")
        )
      )
    })

 data_filter2 <- reactive({
                              data_filter() %>%
                              filter(slugMatchupDate == input$searchgame)
   })


 output$plot <- renderImage({
   DBshots <- data_filter2() %>%
     mutate(gtime=ms(as.character(paste(minutesRemaining,secondsRemaining,sep = ":")))) %>%
     mutate(time_chron=case_when(
       numberPeriod==1~ms("12:00")-gtime,
       numberPeriod==2~ms("24:00")-gtime,
       numberPeriod==3~ms("36:00")-gtime,
       numberPeriod==4~ms("48:00")-gtime,
       numberPeriod==5~ms("52:00")-gtime)) %>%
     mutate(distTrans=if_else(distanceShot==0,0.8,distanceShot))

   anim <-
     ggplot(DBshots)+
     geom_hline(yintercept = 23.9,linetype=2,color="gray")+
     annotate("text",label="from downtown!",x=700,26.5,size=5,alpha=0.5,color="grey70")+
     geom_vline(xintercept = as.numeric(ms("48:00")),linetype=3,color="red")+
     geom_lollipop(aes(x=time_chron,y=distTrans,
                       color=isShotMade))+
     labs(y="shot distance (feet) \n *excludes dunks and free throws",
          x="time (minutes)",
          title = paste0(unique(DBshots$namePlayer),
                         " ",
                         unique(DBshots$slugMatchupDate),
                         sep =" ")) +
     scale_x_time(breaks = ms(c("12:00","24:00","36:00","48:00")))+
     scale_color_manual(values = pal("xmen"), labels = c("made","missed")) +
     theme(text = element_text(size = 19),
           panel.grid.major.x = element_blank(),
           legend.position = "bottom",
           legend.title = element_blank(),
           legend.text = element_text(size=19))+
     guides(color = guide_legend(override.aes = list(size = 4)))+
     theme_farty()+
     transition_states(idEvent)+shadow_mark()

   anim_save("outfile.gif", animate(anim, height = 600, width = 600))
   list(src = "outfile.gif", contentType = "image/gif")
   },
 deleteFile = TRUE
 )

 output$plot2 <- renderImage({
   DBshots <- data_filter2() %>%
     mutate(gtime=ms(as.character(paste(minutesRemaining,secondsRemaining,sep = ":")))) %>%
     mutate(time_chron=case_when(
       numberPeriod==1~ms("12:00")-gtime,
       numberPeriod==2~ms("24:00")-gtime,
       numberPeriod==3~ms("36:00")-gtime,
       numberPeriod==4~ms("48:00")-gtime,
       numberPeriod==5~ms("52:00")-gtime)) %>%
     mutate(distTrans=if_else(distanceShot==0,0.8,distanceShot))

   # to plot a half court, using data from the ballR shiny app
   source("https://raw.githubusercontent.com/toddwschneider/ballr/master/plot_court.R")

   court_themes = list(
     light = list(
       court = '#fffcf2',
       lines = '#999999',
       text = '#222222',
       made = '#00bfc4',
       missed = '#f8766d',
       hex_border_size = 0,
       hex_border_color = "#cccccc"
     ),
     dark = list(
       court = '#000004',
       lines = '#999999',
       text = '#f0f0f0',
       made = '#00bfc4',
       missed = '#f8766d',
       hex_border_size = 0,
       hex_border_color = "#000000"
     )
   )

   #source("https://raw.githubusercontent.com/toddwschneider/ballr/master/court_themes.R")
   plot_court() # created the court_points object we need
   court_points <- court_points %>% mutate_if(is.numeric,~.*10)
     # y coordinates are shifted to account for the backboard+rim in the ballr data
  DBcourt <-
     ggplot(DBshots, aes(x=locationX, y=locationY+45)) +
     scale_fill_manual(#values = c("#00529b","#cc4b4b")
       values = pal("xmen"), guide=FALSE)+
     geom_path(data = court_points,
               aes(x = x, y = y, group = desc),
               color = "black")+
     coord_equal()+
     geom_point(aes(fill=isShotMade),pch=21,size=4,color="white") +
     xlim(-260, 260) +
     #theme_farty()+
     labs(title="Shot location",x="",
          y="") +
     theme(text = element_text(size = 19),
           panel.grid = element_blank(),
           axis.text = element_blank(),
           plot.caption = element_text(color="white"))+
     theme_farty() +
     transition_states(idEvent)+shadow_mark()

   anim_save("outfile2.gif", animate(DBcourt, height=600,width=600))
   list(src = "outfile2.gif", contentType = "image/gif")
   },
 deleteFile = TRUE
 )
 }

# Run the application
shinyApp(ui = ui, server = server)
Since the code takes a long time to render each plot it is not worth publishing on ShinyApps. However, the code can be optimized further. Note to self: Need to edit code to remove top and bottom border in plot2 & order by time asc.
This post is licensed under CC BY 4.0 by the author.


